A new JVLA radio survey of M33
13/03/19 18:35 Filed in: Science
White et al. (2019) have performed new 1.4 GHz and 5 GHz observations of the Local Group galaxy M33 with the Jansky Very Large Array. The survey has a limiting sensitivity of 20 μJy and a resolution of 5.9′′ (FWHM), corresponding to a spatial resolution of 24 pc. This map offers an unique opportunity for the comparison at the same spatial resolution with our planned LUCA IFU spectroscopy of M33 at the Schmidt telescope.
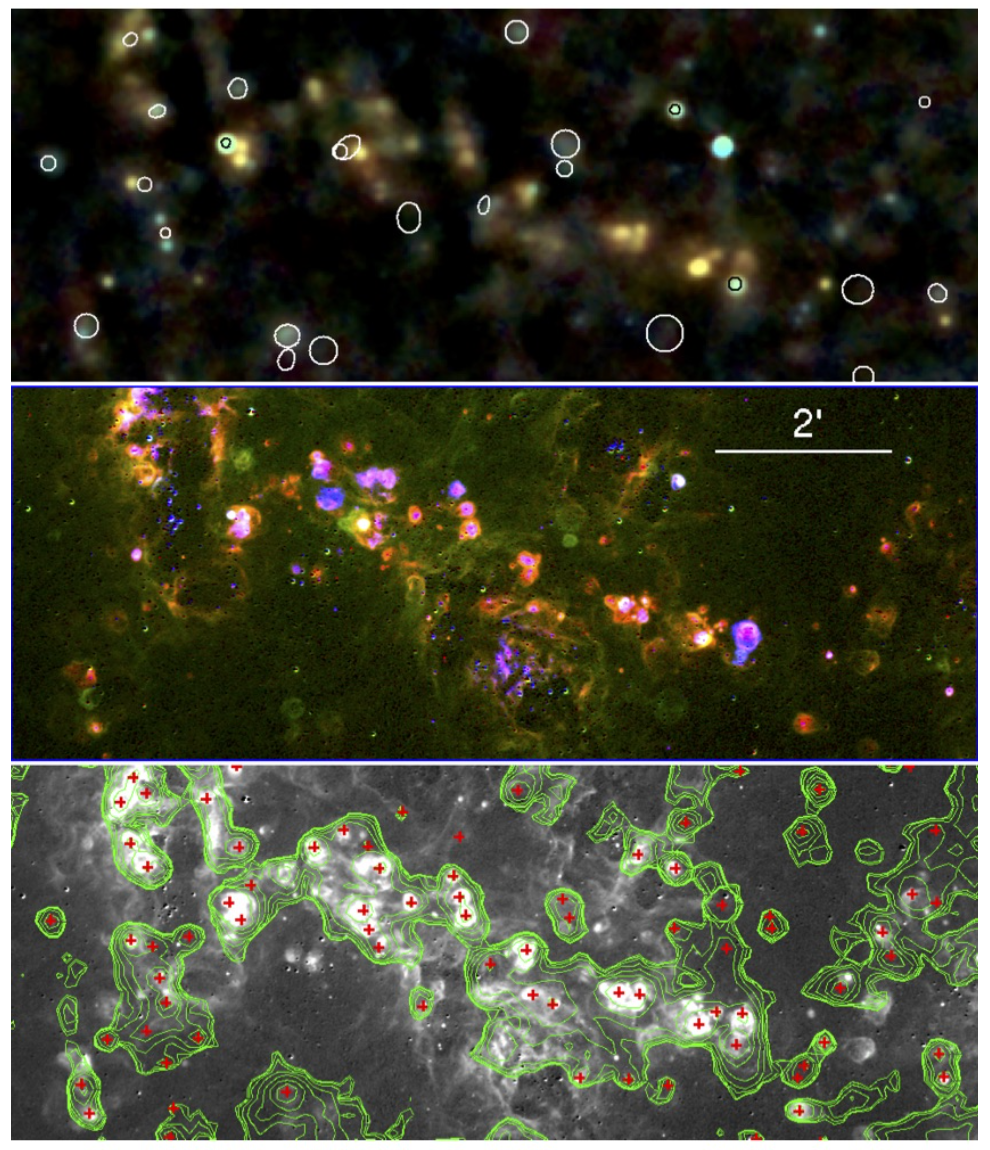
This figure, taken from White et al. (2019), shows a 4.4'′ by 10.7′ region of the southern spiral arm in M33. The top panel is the color radio spectral index map. Locations for optically-detected SNRs are shown as white ellipses; many can be identified by cross-referencing to the middle panel that shows a three-color image of continuum-subtracted emission line data, with Hα in red, [SII] in green, and [OIII] in blue. The bottom panel is a continuum-subtracted Hα image. The green overlay shows radio contours from the 1.4 GHz data. Red crosses mark the positions of radio sources from their catalog in this region. Some of the complexity of making associations between radio sources and either H II regions or SNRs can be seen here.

This figure, taken from White et al. (2019), shows a 4.4'′ by 10.7′ region of the southern spiral arm in M33. The top panel is the color radio spectral index map. Locations for optically-detected SNRs are shown as white ellipses; many can be identified by cross-referencing to the middle panel that shows a three-color image of continuum-subtracted emission line data, with Hα in red, [SII] in green, and [OIII] in blue. The bottom panel is a continuum-subtracted Hα image. The green overlay shows radio contours from the 1.4 GHz data. Red crosses mark the positions of radio sources from their catalog in this region. Some of the complexity of making associations between radio sources and either H II regions or SNRs can be seen here.
Jon Lawrence (AAO) visits the IAA
19/02/19 18:04 Filed in: General
Jon Lawrence, Head of Technology of the Australian Astronomical Observatory (AAO), visited the IAA on Feb. 18-19. Jon spent his time in Granada to work with our group on the progress of the AAO feasibility study of LUCA at CAHA 3.5 m telescope. He also discussed with us the proposal of the AAO spectrograph, design by Robert Content, for the CASS spectrograph at the Schmidt.
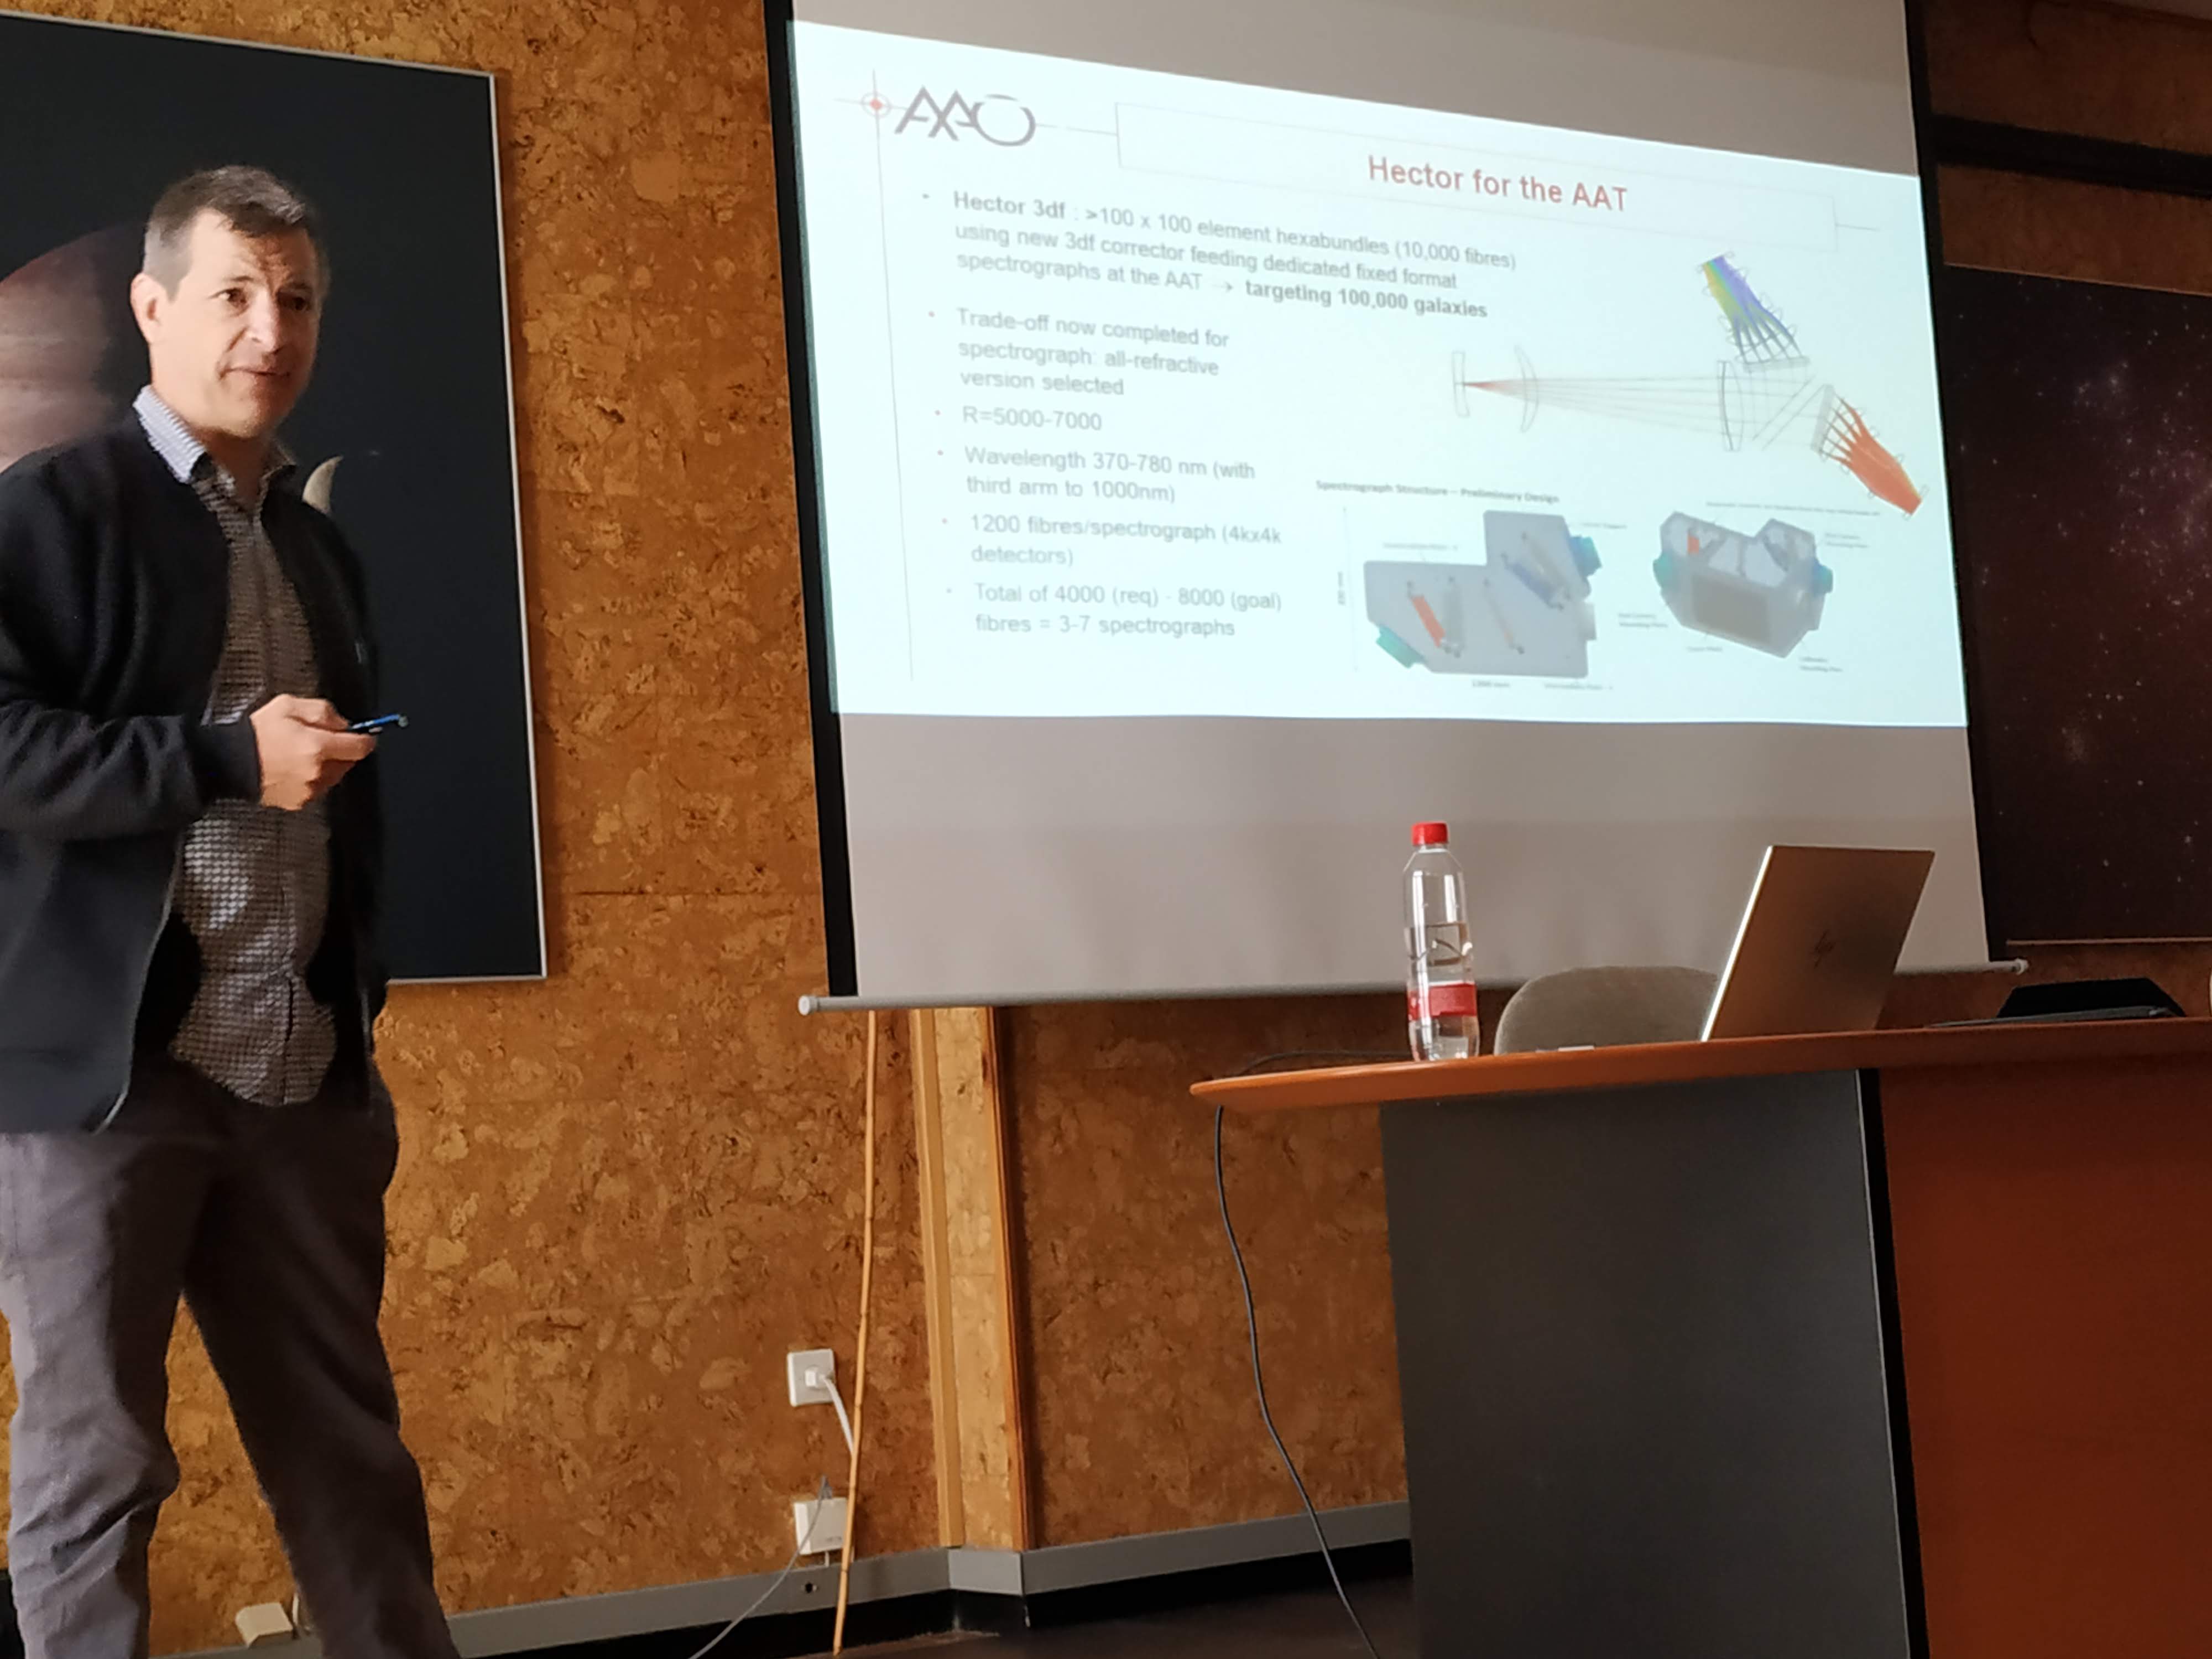
Jon presents the Hector spectrograph at his seminar "Instrument development at the AAO".

Jon presents the Hector spectrograph at his seminar "Instrument development at the AAO".
Assesment of Gaia Guiding Stars
15/02/19 11:10 Filed in: Telescope
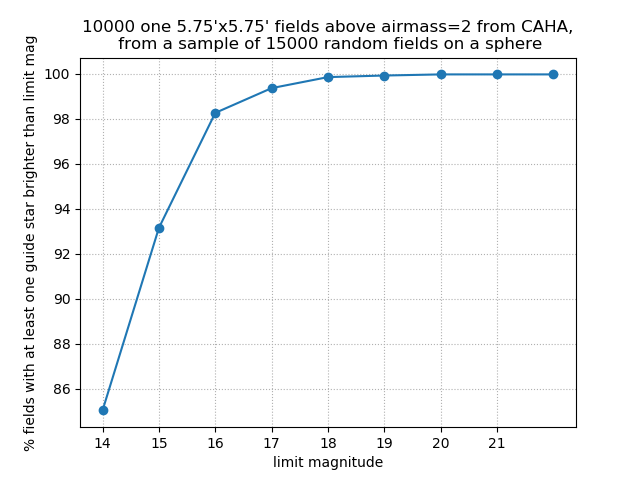
We use the Gaia database through the astroquery interface to generate sky fields with stars. For the Schmidt scale at the focal plane of 86.20 arcsec/mm and a typical guiding detector of size 4x4mm (e.g. a CMOS 1000x1000 pixels of 4micron each) the FoV to search for guiding stars at any one location on sky is 5.75’x5.75’. To study the availability of stars for guiding, we generate random locations on a sphere and select 10000 fields with declination above -22.78º (so that maximum airmass < 2). We then count the stars brighter than a given magnitud (Gaia ‘phot_g_mean_mag’). The figure shows the percent number of these fields with at least one guide star brighter than a given magnitude. Clearly, basically almost any 5.75’x5.75’ location on the sky has guide stars brighter than 16 mag, which guarantees that we can guide by having a single CCD located at the Focal Plane next to the IFU (credit: Enrique Pérez).

IFU cross-talk simulations
14/02/19 13:38 Filed in: Science
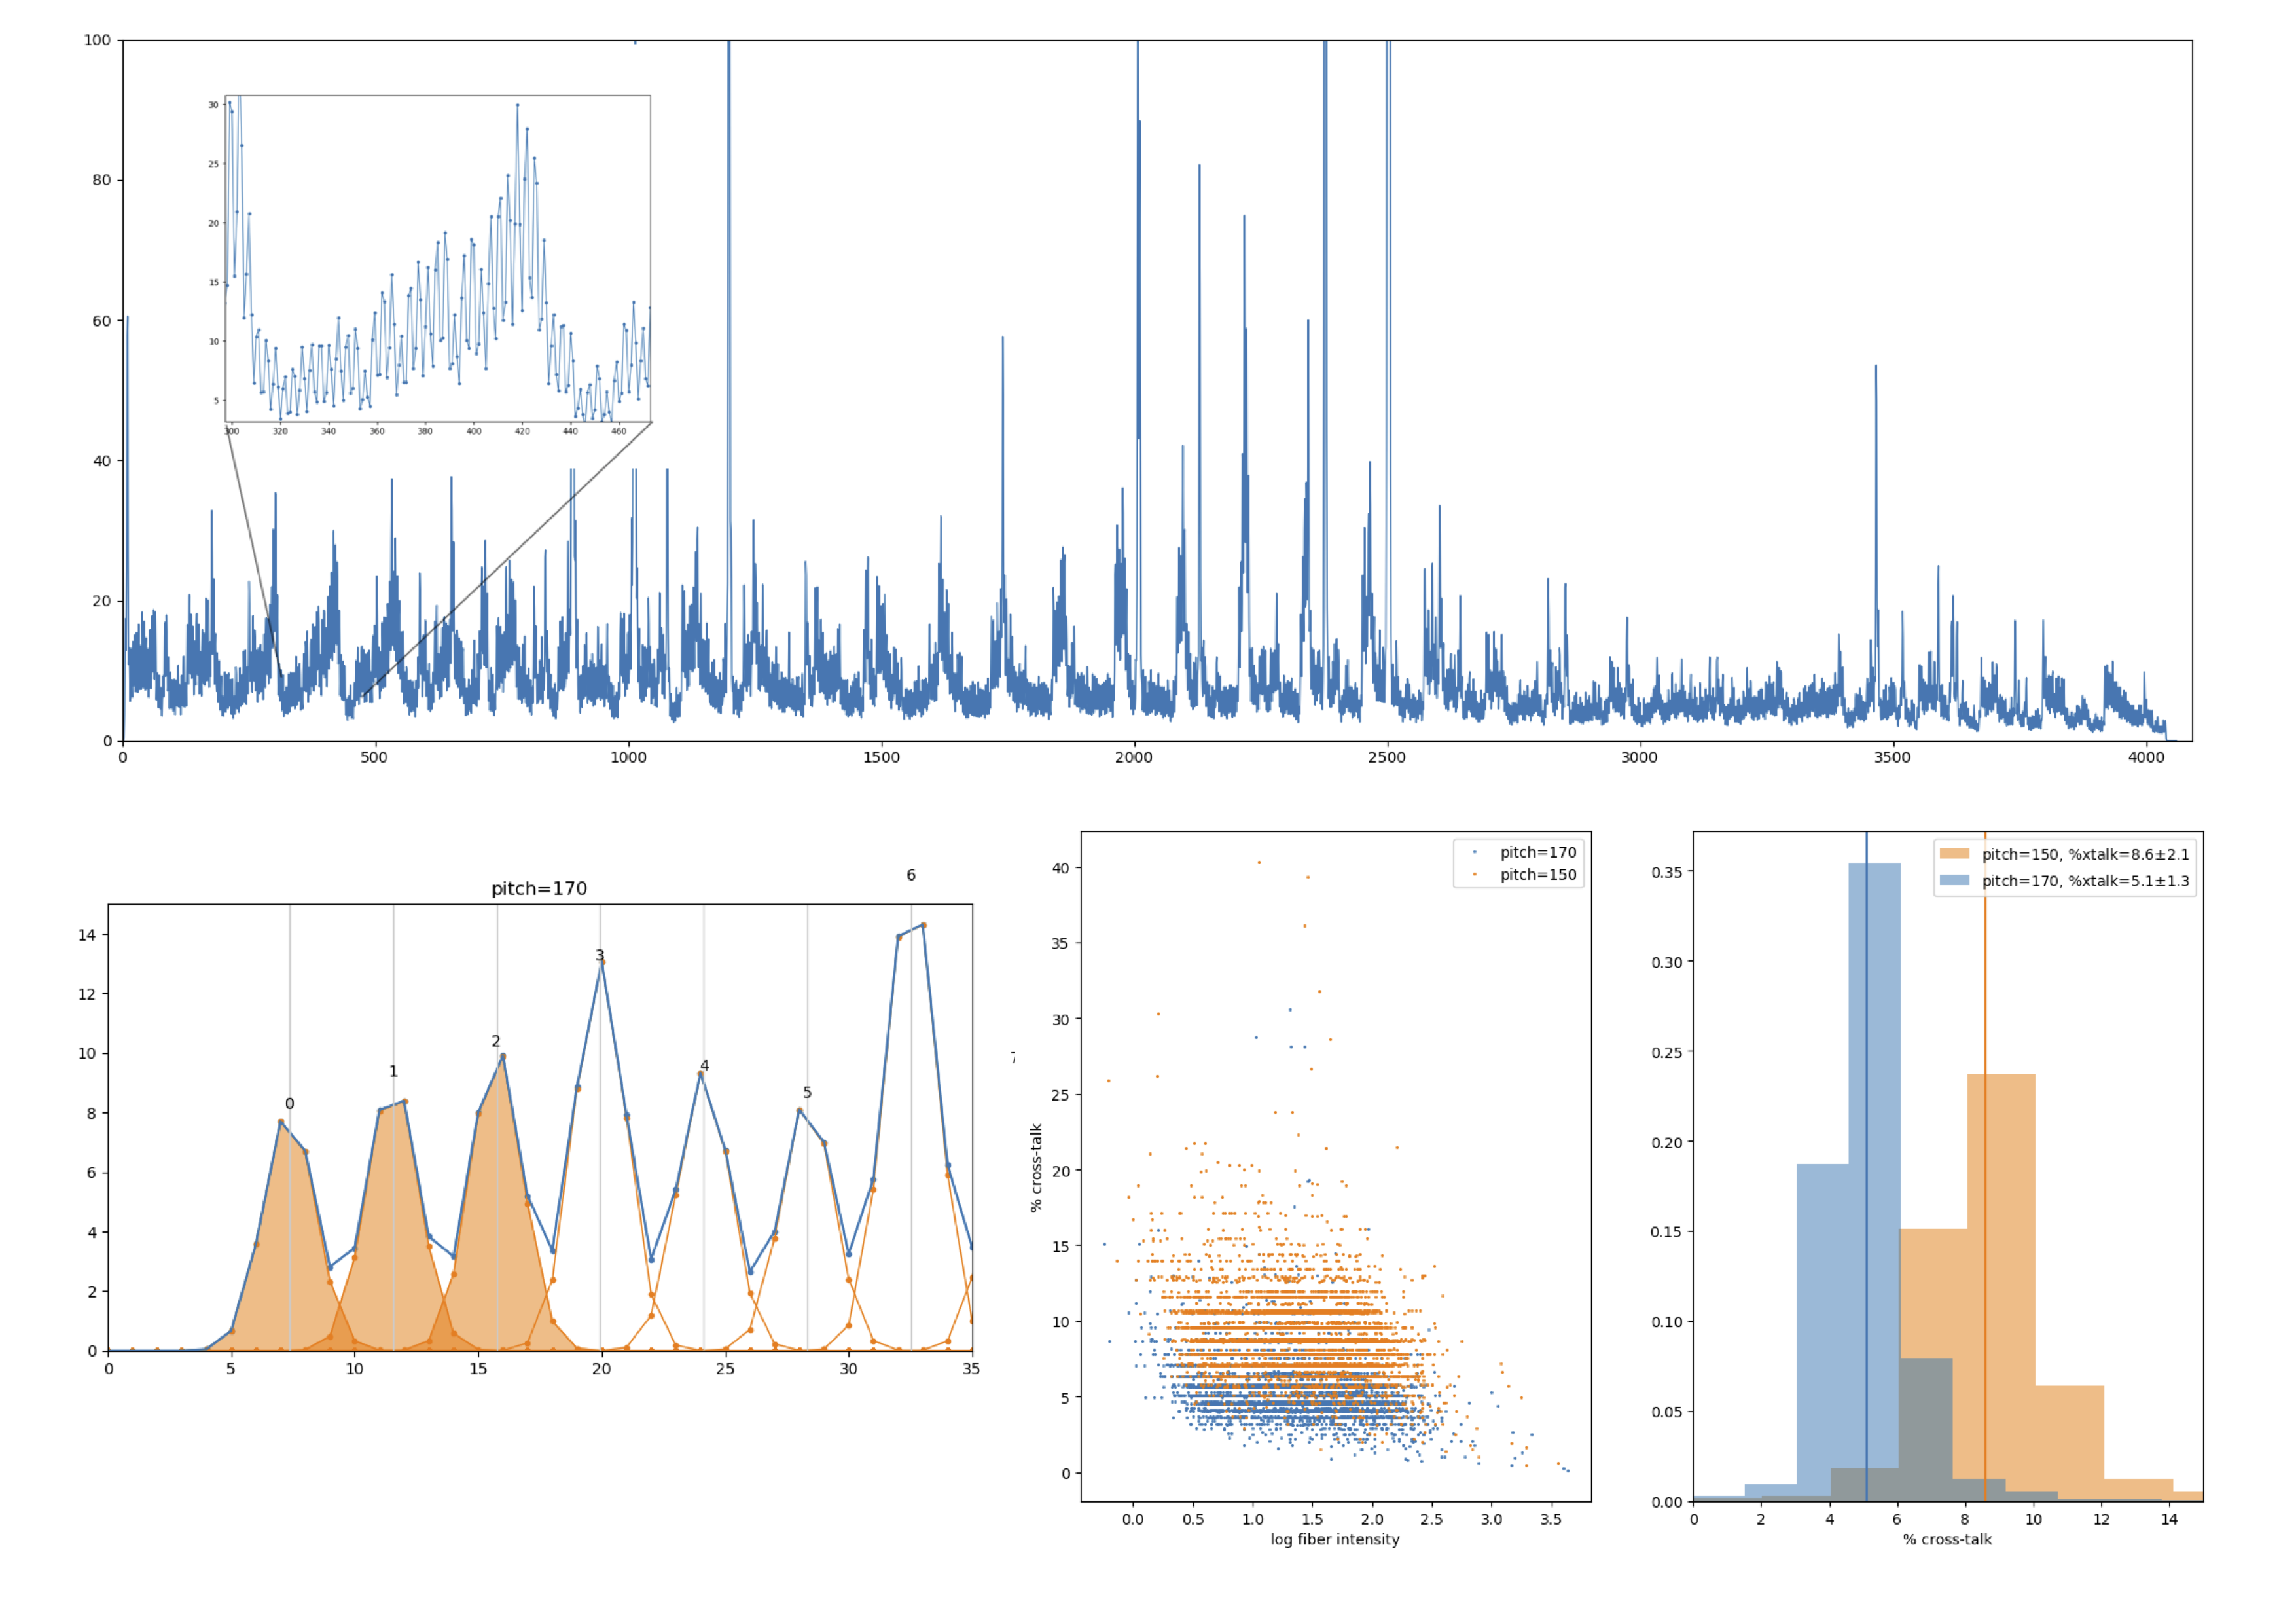
A single IFU pointing (cf. single pointing on M33) generates a spectral-spatial 2D image in the detector, with fibers arranged along the spatial direction. A slice of this image along the spatial direction is shown on the top plot of the enclosed image, with a zoomed in shown in the insert, where the single fiber PSF can be seen. A PSF model (e.g., a Gaussian) is fitted to each fiber PSF as shown in the bottom-left figure (in orange in the figure), and the cross-talk is defined as the fraction of the PSF that falls below neighbour fibers (darker orange wings). The two bottom-right figures give the values of cross-talk extracted for two different values of the fiber pitch at slit (the peak-to-peak separation of fibers along the slit) with values of 150 and 170 micron (credit: Enrique Pérez).

First actions on the Schmidt telescope
13/02/19 11:01 Filed in: Telescope
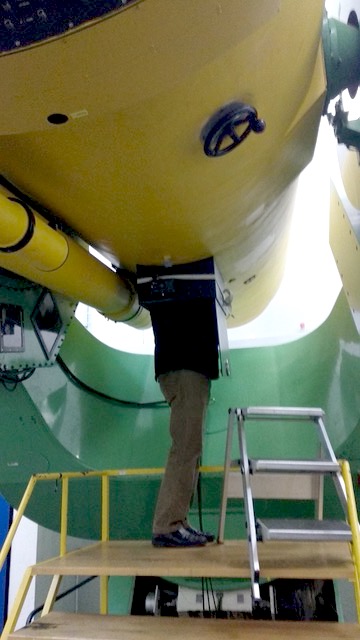
Assessment of the Focal Plane Assembly at the Schmidt telescope by a member of our engineering team. Work done in collaboration with the CAHA staff.
 CASS Blog